.png)
Being in charge of office spaces and the experiences employees have within those spaces is a monumental task in today’s world. Time and time again, we’ve seen differing opinions on the “right” amount of time to spend in the office, if any. Those tasked with managing return to office logistics, health concerns, employee experience, and the whole laundry list of additional tasks not only have to pull everything together but do it while dancing between competing interests. They are the unsung superheroes during this period.
One of our primary pillars at Tactic is to help workspace managers be superheroes. This goal focuses on two areas:
Today we’re announcing the launch of what we're calling Reports 2.0. This replaces the entire “Reports” section within all accounts starting today. All of the existing tables and visualizations have been baked into the new Reports, alongside many new ones.

With our Reports 1.0 product, we learned a lot. We heard from customers daily that our solution checked some of the basic boxes but it wasn't enough. The feedback was clear:
Additionally, as the hybrid work market has continued to evolve and different experiments are carried out across teams, many more questions need answering. Not just the basic questions like, "How many people have come into the office today" but also things like:
All critical questions when you’re trying to figure out the return to office and coordinate across teams.
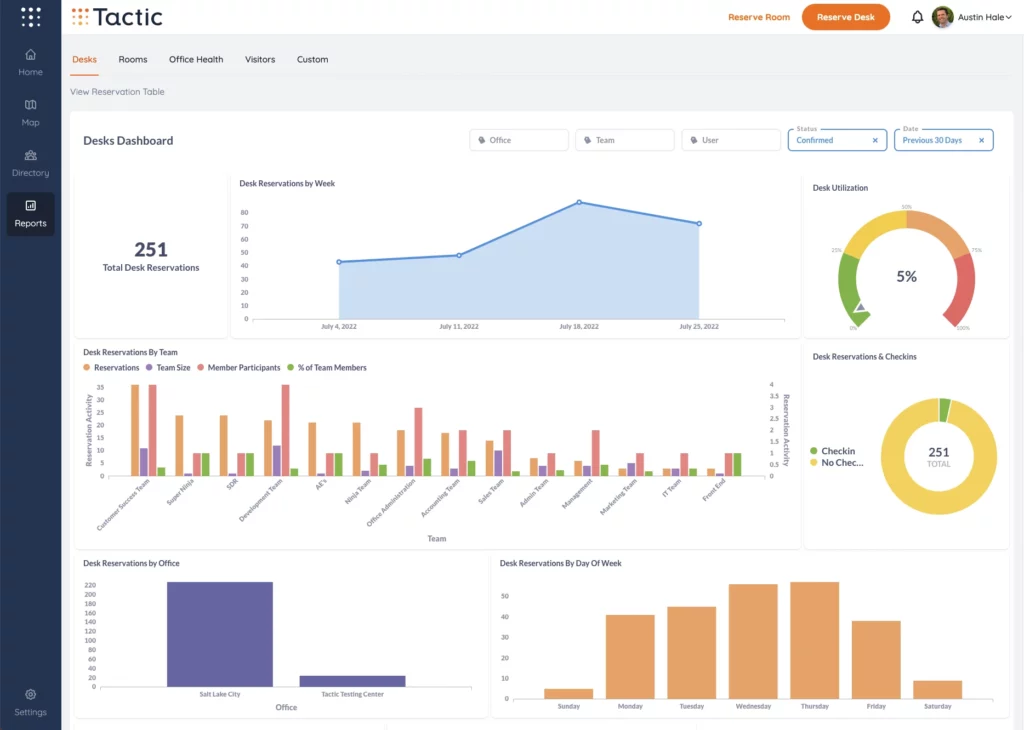
With today’s launch there are now four dashboards filled with a variety of insights on how the office is being utilized within your organization:
Each dashboard is backed by granular data tables that provide the data in an easy-to-read format.
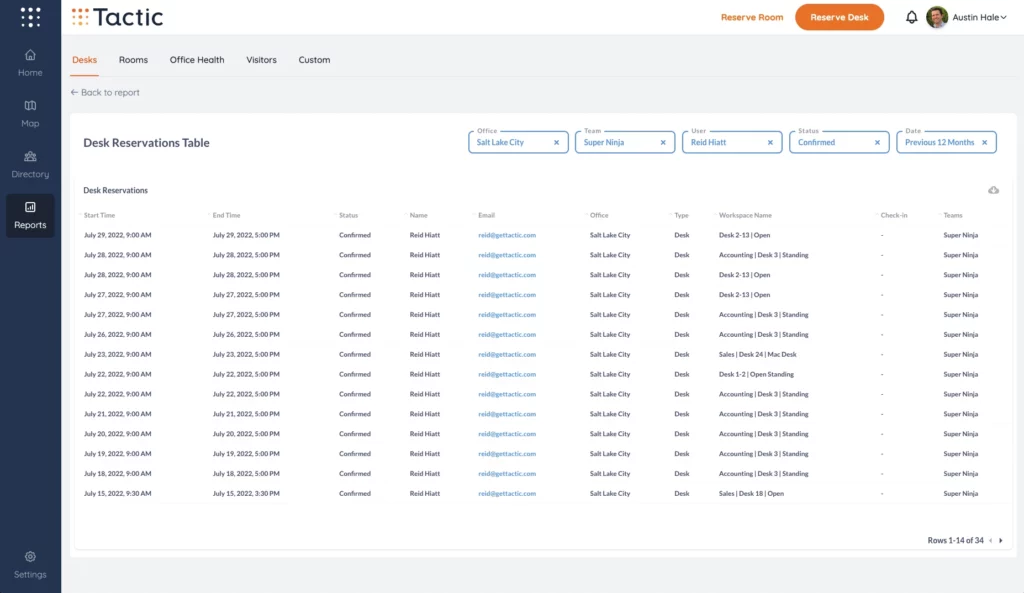
You can filter your results using dates, offices, teams, users and other relevant criteria. Most importantly, this data, along with the data within the visualizations themselves, can all be exported to CSV (or Excel’s xlsx or JSON) with a single click.
Most businesses and organizations have some sort of data team and without fail they’re all really busy. Most businesses also have a lot of different office apps: lease management, access control badge systems, density sensors, air quality, and more. It’s a very tall order to convince busy data teams to tackle the process of taking the data from a variety of sources: CSVs, hand modified excel sheets, etc. and creating a customized, auto-updating visualization that uses the combined data.
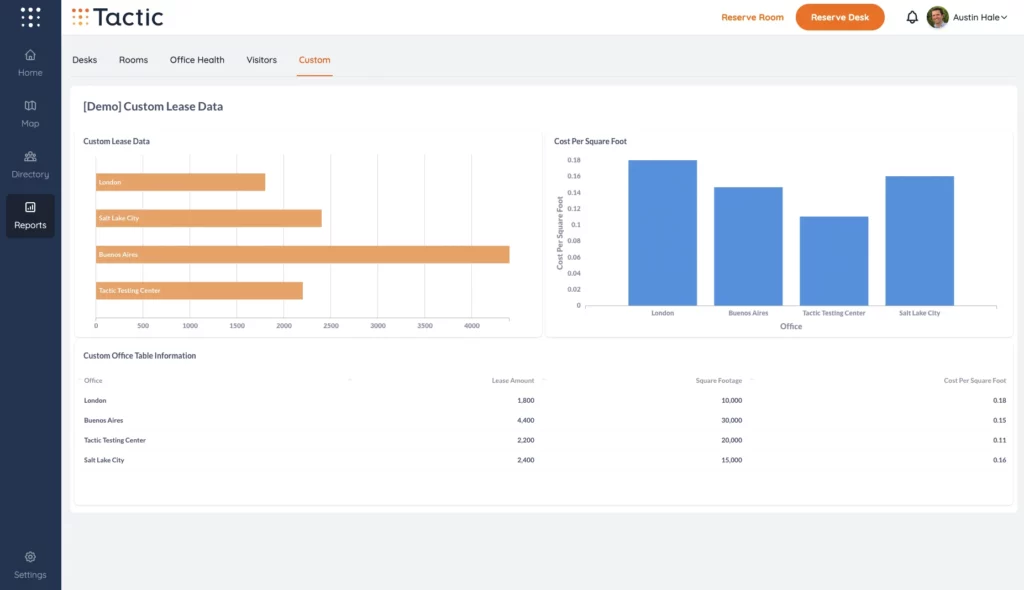
We took a good hard look at the space and decided it would be silly for every one of our customers to re-create visualizations from scratch over and over. We decided to put in the blood, sweat, and tears (and there were tears) to pre-build visualizations that combine data with common third party application sources, alongside your Tactic usage data to give you unique insights into your organization’s workplace experience. Not using an app? Have everything in a manually updated spreadsheet? Not an issue.Let’s look at an example.Let’s say your office is using a badge system to permit entry and this system has a way to export those logs. Wouldn't it be nice to directly compare that to desk reservations & checkins? What about that one shared spreadsheet where you track lease costs & renewals that everyone internally emails back and forth with "v_12", "final_final" at the end of the title, wouldn't it be great to see office usage mapped against cost per square foot/meters?With Tactic’s new automated data syncing connectors, you could add two new dashboards and have the data updating in near real-time:
Not quite ready to sync custom data but still need a specific question answered? We've got you covered. Time and time again we heard requests along the lines of, “This report works but it would be perfect if it had X”. The difficulty when building software products for office teams is that very infrequently is “X” ever exactly the same thing.With this in mind, we've added the ability to create custom dashboards for individual organizations on a one-off basis. Really, really need to see a double bar chart showing the number of desk reservations compared to the daily number of office visitors every Tuesday? No problem.If you're interested in syncing custom data or are interested in getting a custom dashboard created in your account, reach out to your account manager or reach out directly to the success team [email protected]We're incredibly excited to see the insights your team can get with this new version of Tactic reports. As work and the workplace continues to evolve, please continue to send feedback our direction. Every new question and dashboard request is an opportunity to continue to explore how to best support workspace superheroes.
A workplace experience platform that brings your hybrid team together.
 Tessa
Tessa