

If you run a hybrid office, you can probably guess which days feel busiest. The harder question is how much the week tilts toward the middle and what workplace teams should actually do about it.
We looked at 4.2M desk and room reservations across 400+ organizations. More importantly, we grouped them by the day people planned to be in the office, not the day they happened to click book.
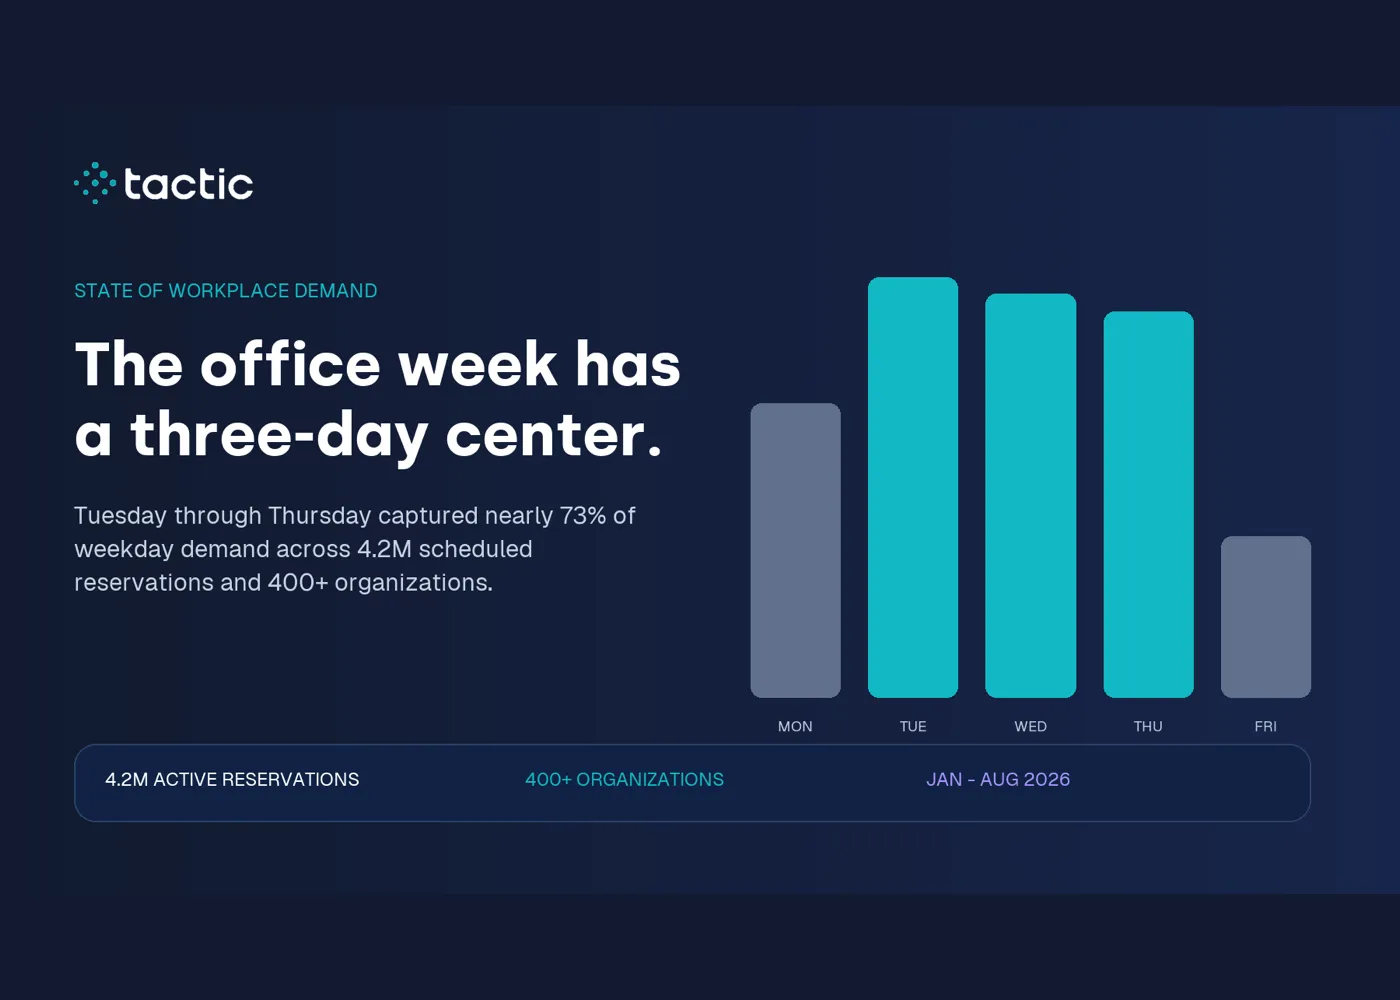
The result was clear: nearly 73% of weekday demand landed between Tuesday and Thursday.
That does not mean every office should copy the same schedule. It does mean a smooth five-day average can hide the days when the workplace is under the most pressure.
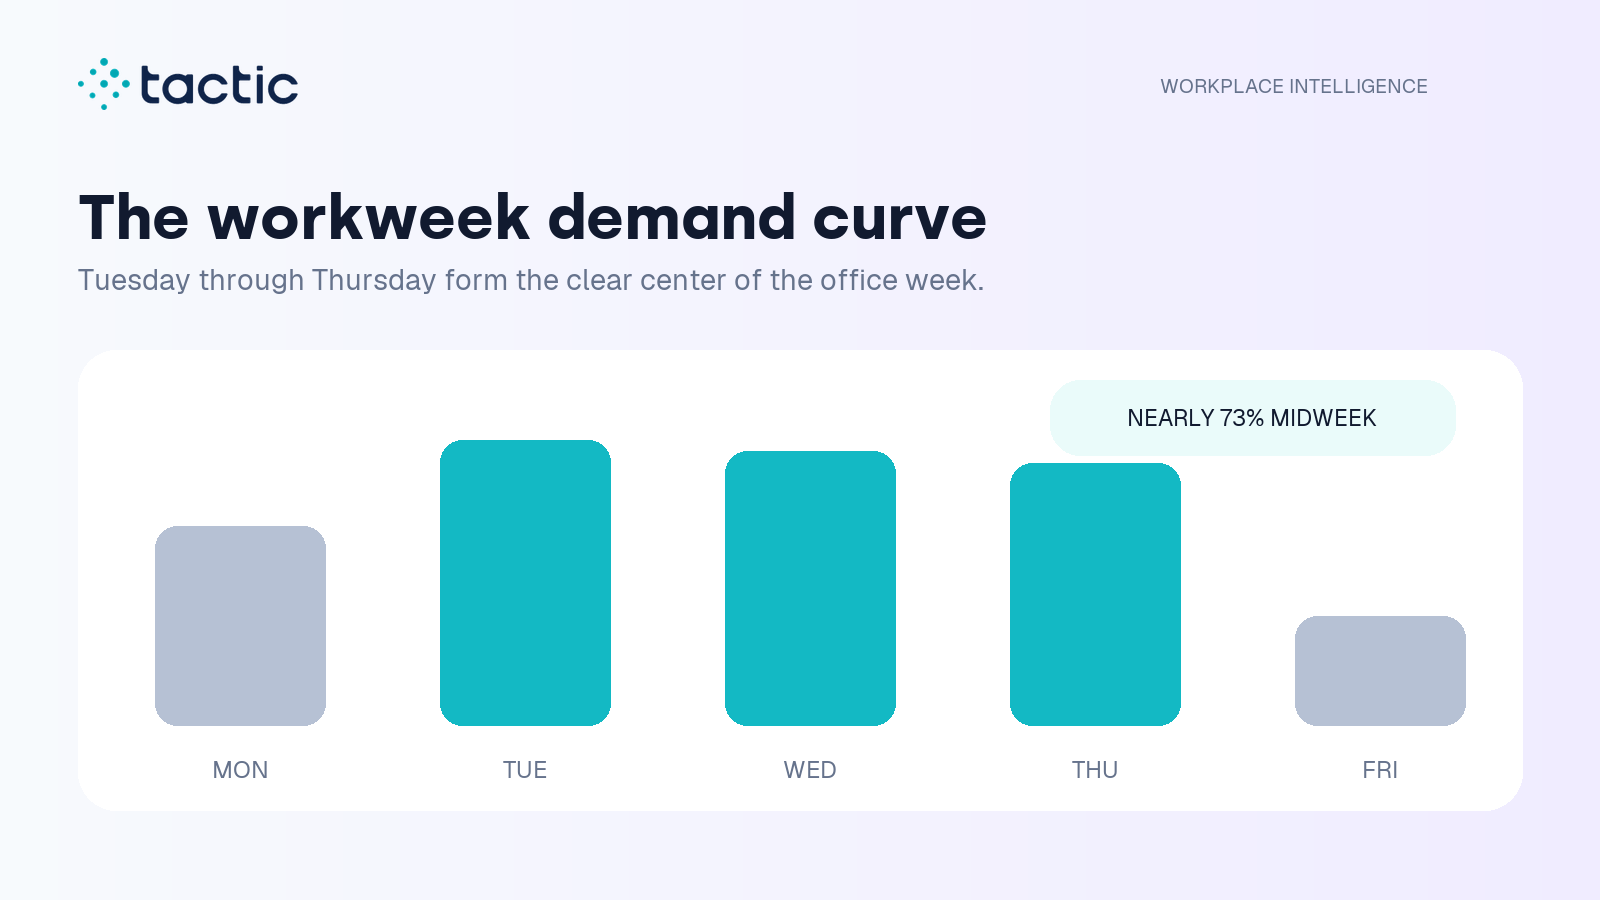
Tuesday was the busiest scheduled office day. Wednesday was just behind it, and Thursday remained close. Monday still mattered, while Friday followed a much lighter pattern.
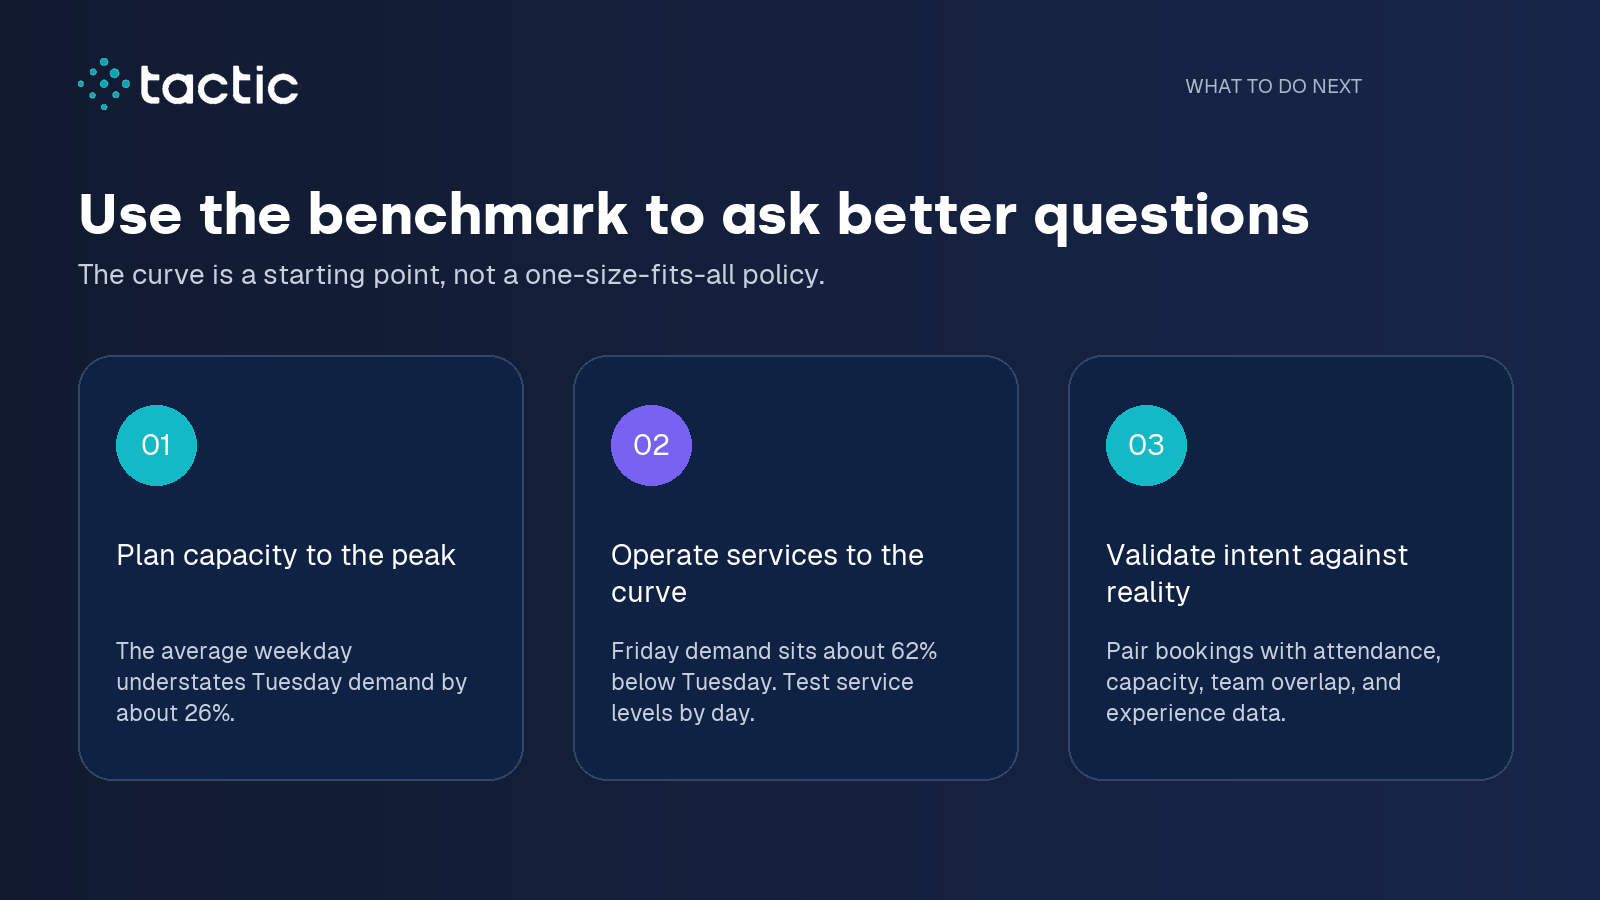
The more useful comparison is the gap between the average and the peak. Tuesday demand ran about 26% above the average weekday. Friday demand was about 62% below Tuesday.
That is a big operating difference. A workplace team using one staffing or service assumption for all five days could easily be stretched during the middle of the week and overspend at the end of it.
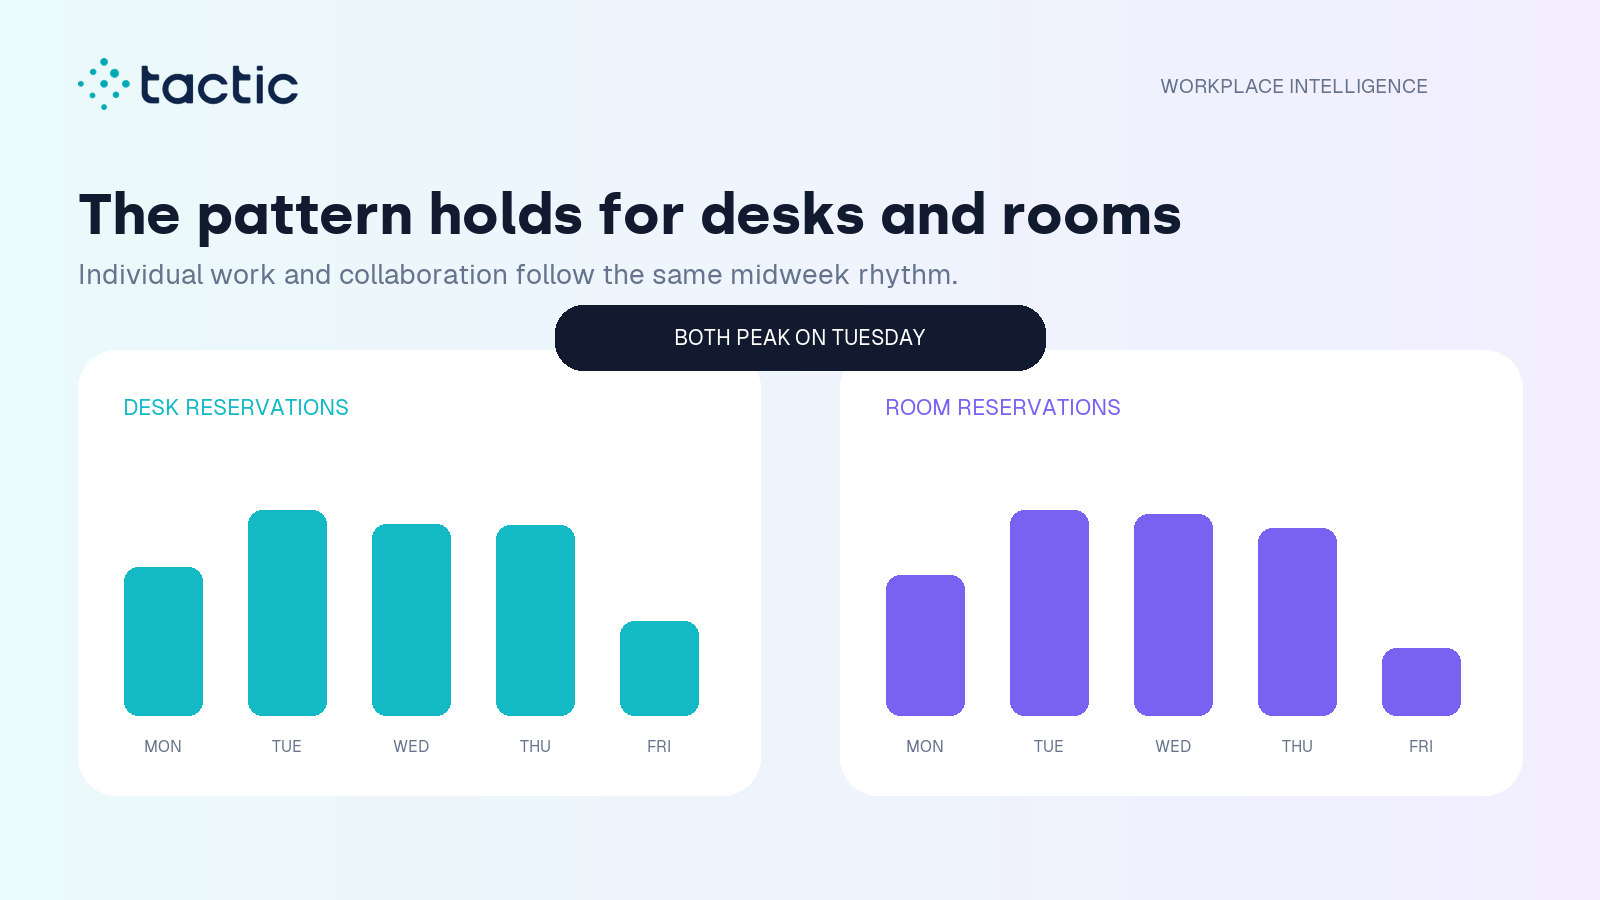
We also wanted to know whether the midweek peak was mostly a desk-booking habit. It was not.
Desk reservations and room reservations both peaked on Tuesday, remained strong on Wednesday and Thursday, and dropped on Friday. That matters because it suggests the midweek pressure is broader than desk availability. Individual work and collaboration are moving together.
It also means workplace teams should look beyond the desk count. Meeting-room availability, hospitality, support coverage, food, transportation, and shared-space experience can all feel the same midweek strain.
Tuesday is the stress test. Look at whether desks, rooms, services, and support still work when demand is at its highest.
Monday remains meaningful, but Friday is a different kind of day. Teams can test lighter service levels, alternative programming, or maintenance windows without treating every weekday as interchangeable.
A reservation shows intent. It does not confirm that someone arrived, how many people attended a room booking, whether the right teams overlapped, or whether the office supported useful work.
Before changing space or policy, pair booking data with attendance, occupancy, usable capacity, and employee experience.
The office week is not evenly distributed. It has a pronounced three-day center, and that concentration changes how teams should think about capacity, staffing, services, and the employee experience.
The benchmark gives workplace leaders something concrete to compare against. Your own curve may be flatter, more Monday-heavy, or shaped by local policy and culture. That difference is the point. Start with the market pattern, compare it with your own workplace, and plan around what is actually happening.
This analysis covers 4.2M anonymized, aggregated active desk and room reservations scheduled in Tactic from January through August 2026 across 400+ organizations. Reservations were grouped by their scheduled local start date rather than the date they were created.
Weekend activity remains in the total but represented less than 1% of reservations, so the primary charts focus on Monday through Friday. Cancelled and other inactive records were excluded, along with recurring parent records that represent a series rather than an individual occurrence.
The results are activity-weighted, meaning organizations with more reservations contribute more to the aggregate. A room reservation counts as one reservation and does not estimate attendance. Treat the findings as a directional benchmark and compare them with your own attendance, capacity, and workplace-experience data.
Download the State of Workplace Demand 2026 PDF

One platform for your entire workplace.